What is velocity-time graph? Sate how it can be used to find:
i. acceleration of a body
ii. the displacement of a body, and
iii. the distance travelled in a given time
The Velocity – Time graph gives the change of velocity with the change in time.
Y – Axis : Velocity
X – Axis : Time
Now, slope of velocity – time graph is gives as
Slope = ![]() =
= ![]()
Since, y = v (Velocity)
And x = t (Time)
Now, there are three types of Velocity – Time graph.
a) Velocity is constant – Uniform Motion
This means that velocity remains same for all time.

b) Uniformly Accelerated Motion
This means that velocity changes at constant rate.
Slope = Constant and the graph is a straight line graph

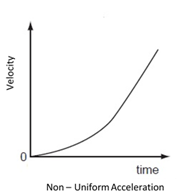
c) Non – Uniformly Accelerated Motion
This means that velocity changes at a variable rate.
Slope = Variable and the graph is as shown below
Velocity – Time Graph can be used to find the following as:
a) Acceleration:
Slope of Velocity – Time Graph = Acceleration
Since, Slope = ![]()
So, Acceleration = ![]()
And hence, Slope = Acceleration
b) Displacement of a body:
The area under the velocity – time graph gives the displacement of the body.
Displacement = Velocity × Time
Area under the graph = Displacement of Body
For finding the area, we multiply the velocity and time.

c) Distance of a body:
Distance = Speed × Time
Now, Speed is magnitude of velocity.
Hence, as long as velocity is positive,
Area under the curve = Distance
NOTE:
If velocity is negative, then the area under the curve is negative and then the total area gives displacement. So, in that case,
Distance ![]() Displacement
Displacement
Example:
Let the velocity – time graph be as shown below:
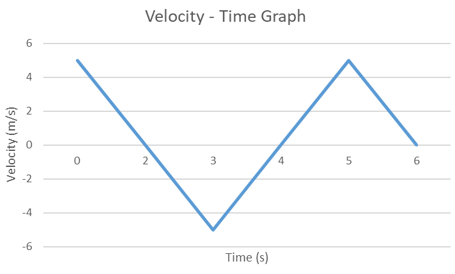
Now, Displacement = Area under the curve
= ![]()
= 5 m
Whereas, Distance = ![]()
= 15 m
For displacement we have considered the area below the time axis as negative whereas for distance, we have considered all areas as positive.