During the medical check-up of 35 students of a class, their weights were recorded as follows:
Weight (in kg) | Number of students |
Less than 38 Less than 40 Less than 42 Less than 44 Less than 46 Less than 48 Less than 50 Less than 52 | 0 3 5 9 14 28 32 35 |
Draw a less than type ogive for the given data. Hence obtain the median weight from the graph and verify the result by using the formula
The frequency distribution table of less than type graph is as follows:
Weight (in kg) Upper class limits | No. of students (Cumulative Frequency) |
Less than 38 Less than 40 Less than 42 Less than 44 Less than 46 Less than 48 Less than 50 Less than 52 | 0 3 5 9 14 28 32 35 |
Now,
Taking upper class interval on x-axis and their respective frequencies on y-axis, ogive will be:
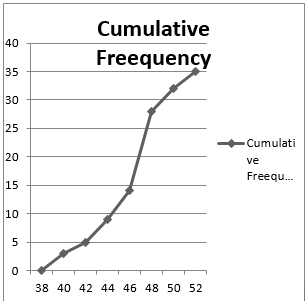
Here, N = 35
![]()
Mark the point A whose ordinate is 17.5 and is x-ordinate is 46.5.
Hence,
Median of the data is 46.5
Now,
It can be observed that the difference between two consecutive upper class limits is 2
The class marks with respective frequencies are obtained below:
Weight (in kg) | frequency | Cumulative Frrequency |
Less than 38 | 0 | 0 |
38-40 | 3 | 3 |
40-42 | 2 | 5 |
42-44 | 4 | 9 |
44-46 | 5 | 14 |
46-48 | 14 | 28 |
48-50 | 4 | 32 |
50-52 | 3 | 35 |
N | 35 |
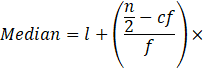
We can see that the cumulative frequency is greater than n/2 and is 28 which belongs to the interval 46-48
Hence,
Median class = 46-48
Lower limit, l = 46
cf = 14
f = 14
h = 2
Now,
Median can be calculated as:
![]()
![]()
= 46.5