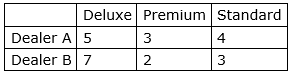
The sales figure of two car dealers during January 2013 showed that dealer A sold 5 deluxe, 3 premium and 4 standard cars, while dealer B sold 7 deluxe, 2 premium and 3 premium and 4 standard cars, while dealer B sold 7 deluxe, 2 premium and 3 standard cars. Total sales over the 2 month period of January – February revealed that dealer A sold 8 deluxe 7 premium and 6 standard cars. In the same 2 month period, dealer B sold 10 deluxe, 5 premium and 7 standard cars. Write 2 x 3 matrices summarizing sales data for January and 2 – month period for each dealer.
By creating tables, we have
For January 2013
For January to February

Hence, we can form 2×3 matrices as
A = ![]() and B =
and B = ![]()
18