Sketch the graph y = |x - 5|. Evaluate  . What does this value of the integral represent on the graph?
Given equations are:
y = |x - 5|
y1 = x - 5, if x - 5 ≥ 0
y1 = x - 5 …… (1), if x ≥ 5
And y2 = - (x - 5), if x - 5 < 0
y2 = - (x - 5) …… (2), if x < 5
So, equation (1) is straight line that passes thorough (5,0). Equation (2) is a line passing through (5,0) and (0,5). So, the graph of which is as follows:
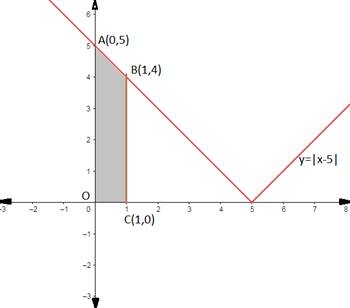

![]() (As when x is between (0,1) the given equation becomes y = - (x - 5) as shown in equation (2) shown ass shaded region in the above graph)
(As when x is between (0,1) the given equation becomes y = - (x - 5) as shown in equation (2) shown ass shaded region in the above graph)
![]() (from equation (2))
(from equation (2))
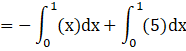
Now integrating by applying power rule, we get
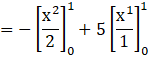
Now applying the limits we get

![]()
![]()
Hence the value of ![]() represents the area of the shaded region OABC (as shown in the graph) and is equal to
represents the area of the shaded region OABC (as shown in the graph) and is equal to ![]() square units.
square units.