Sketch the graph y = |x + 3|. Evaluate  . What does this integral represent on the graph?
Given equations are:
y = |x + 3|
y1 = x + 3, if x + 3 ≥ 0
y1 = x + 3 …… (1), if x ≥ - 3
And y2 = - (x + 3), if x + 3 < 0
y2 = - (x + 3) …… (2), if x < - 3
So, equation (1) is straight line that passes thorough ( - 3,0) and (0,3). Equation (2) is a line passing through ( - 3,0). So, the graph of which is as follows:
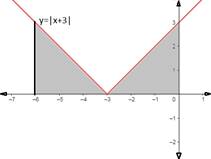

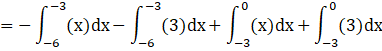
![]() (As x is between ( - 6, - 3) in first shaded region equation becomes as y2 and when x is between ( - 3,0) for the second shaded region equation becomes y1)
(As x is between ( - 6, - 3) in first shaded region equation becomes as y2 and when x is between ( - 3,0) for the second shaded region equation becomes y1)
![]() (from equation (2))
(from equation (2))
Now integrating by applying power rule, we get
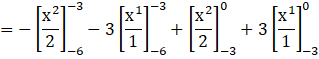
Now applying the limits we get

![]()
![]()
Hence the value of ![]() represents the area of the shaded region (as shown in the graph) and is equal to 9 square units.
represents the area of the shaded region (as shown in the graph) and is equal to 9 square units.