The shoppers who come to a departmental store are marked as: man (M), woman (W), boy (B) or girl (G). The following list gives the shoppers who came during the first hour in the morning:
W WW G B W W M G G M M W WWW G B M W B G G M W W M M W WW M W B W G M W WWW G W M M W W M W G W M G W M M B G G W
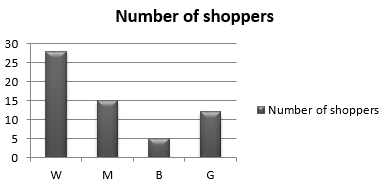
Make a frequency distribution table using tally marks. Draw a bar graph to illustrate it.
The frequency distribution table of the given data can be represented as:
Shopper | Tally marks | Number |
W |
| 28 |
M |
| 15 |
B |
| 5 |
G |
| 12 |
The bar graph of the given data:
11