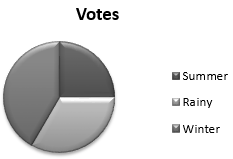
A group of 360 people were asked to votefor their favourite season from the threeseasons rainy, winter and summer.
(i) Which season got the most votes?
(ii) Find the central angle of each sector.
(iii) Draw a pie chart to show thisinformation.

(i) Winter got the most number of votes as observed in the graph.
(ii) Central Angle can be calculated as follows:
Total number of votes:
90 +120 +150 = 360
Season | Number of votes | In fraction | Central angle |
Summer | 90 |
|
|
Rainy | 120 |
|
|
Winter | 150 |
|
|
(iii) The pie chart for the given data is:
19