Use the tables below to draw linear graphs.
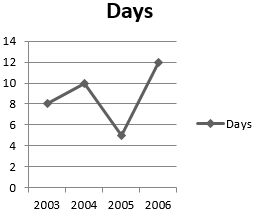
A. The number of days a hill side city received snow in different years.
Year | 2003 | 2004 | 2005 | 2006 |
Days | 8 | 10 | 5 | 12 |
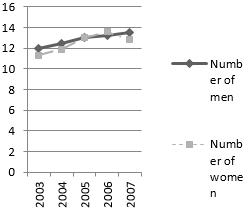
B. Population (in thousands) of men and women in a village in different years.
Year | 2003 | 2004 | 2005 | 2006 | 2007 |
Number of Men | 12 | 12.5 | 13 | 13.2 | 13.5 |
Number of Women | 11.3 | 11.9 | 13 | 13.6 | 12.8 |
A. By taking the years on x-axisand the number of days on y-axis, the linear graph of the given information can be represented as:
B. By taking the years on x-axis and population on y-axis, the given information can be represented through linear graph as:
26