Solve each of the following linear programming problems by graphical method.
Maximize Z = 4x + 3y
Subject to :
8x + 6y ≤ 48
3x + 4y ≤ 24
x ≤ 5 , y ≤ 6
x, y ≥ 0
Ideas required to solve the problem:
• Fundamentals of plotting a linear equation. 2 coordinates are sufficient to plot a straight line.
• A linear inequation represents a region of XY plane when plotted.
• For linear programming we define various linear constraints and combining them we get a region in the XY plane which represents a region of feasible operation subject to various constraints.
• But our objective in the linear programming problem is to optimize (maximize or minimize) our objective function and it will be optimal only at one of the corner points of the feasible region. So we check the value of the objective function at every corner points and hence find maximum or minimum
Given,
Objective function is: Z = 4x + 3y
Constraints are:
8x + 6y ≤ 48
3x + 4y ≤ 24
x ≤ 5
y ≤ 6
x, y ≥ 0
First convert the given inequations into corresponding equations and plot them:
8x + 6y ≤ 48 → 8x + 6y = 48 (corresponding equation)
Two coordinates required to plot the equation are obtained as:
Put, x = 0 ⇒ y = 8 (0,8) - - - - first coordinate.
Put, y = 0 ⇒ x = 6 (6,0) - - - - second coordinate
Join them to get the line.
As we know, Linear inequation will be a region in the plane, and we observe that the equation divides the XY plane into 2 halves only, so we need to check which region represents the given inequation,
If the given line does not pass through origin then just put (0,0) to check whether inequation is satisfied or not. If it satisfies the inequation origin side is the required region else the other side is the solution.
Similarly, we repeat the steps for other inequation also and find the common region.
3x + 4y ≤ 24 → 3x + 4y = 24 (corresponding equation)
Two coordinates required to plot the equation are obtained as:
Put, x = 0 ⇒ y = 6 (0,6) - - - - first coordinate.
Put, y = 0 ⇒ x = 8 (8,0) - - - - second coordinate
x = 0 is the y - axis and y = 0 is the x - axis
x = 5 and y = 6 are lines parallel to y - axis and x - axis respectively.
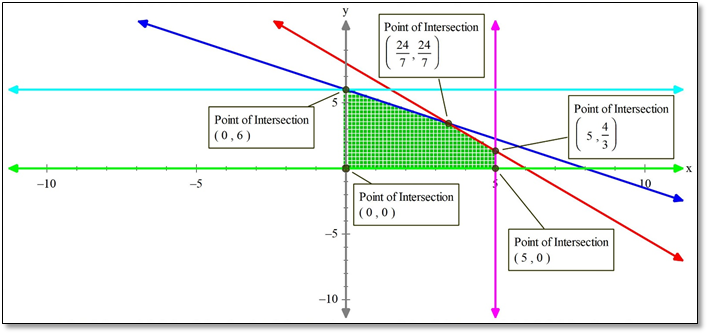
Hence we obtain a plot as shown in figure:
The shaded region in the above figure represents the region of a feasible solution.
Now to maximize our objective function, we need to find the coordinates of the corner points of the shaded region.
We can determine the coordinates graphically our by solving equations. But choose only those equations to solve which gives one of the corner coordinates of the feasible region.
Solving 3x + 4y = 24 and 8x + 6y = 48 gives ![]()
Similarly, solve other combinations by observing graph to get other coordinates.
From the figure we have obtained coordinates of corners as:
(0,0) (5,0) (0,6), ![]() ,
, ![]()
Now we have coordinates of the corner points so we will put them one by one to our objective function and will find at which point it is maximum.
∵ Z = 4x + 3y
∴ Z at ![]()
Z at (0,6) = 4 × 0 + 3 × 6 = 18
Z at (5,0) = 4 × (5) + 3 × 0 = 20
Z at (0,0) = 0
Z at ![]()
We can see that Z is maximum at ![]() and max. value is 24
and max. value is 24
∴ Z is maximum at x = 24/7 and y = 24/7 ; and max value is 24
Also it has a maximum at x = 5 and y = 4/3 with max value = 24