Sketch the graphs of the following functions :
u(x) = sin2 x, 0 ≤ x ≤ 2π υ(x) = |sin x|, 0 ≤ x ≤ 2π
We know that g (x) = sin x is a periodic function with period π.
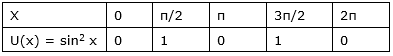
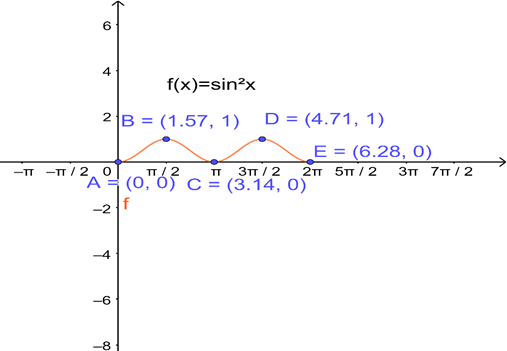
∴ u (x) = sin2 x is a periodic function with period 2π. So, we will draw the graph of u (x) = sin2 x in the interval [0, 2π]. The values of u (x) = sin2 x at various points in [0, 2π] are listed in the following table:
By plotting the above points, we obtain the required curve.
Then,
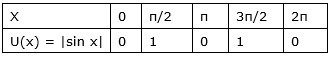
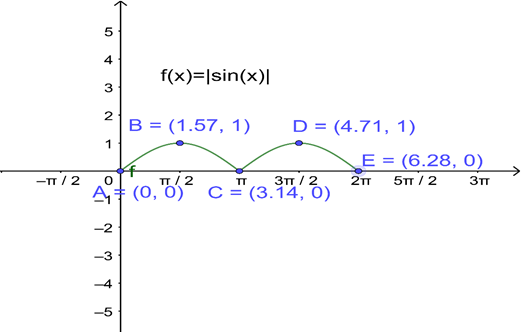
∴ u (x) = |sin x| is a periodic function with period 2π. So, we will draw the graph of u (x) = |sin x| in the interval [0, 2π]. The values of u (x) = |sin x| at various points in [0, 2π] are listed in the following table:
By plotting the above points, we obtain the required curve.
1