Sketch the graphs of the following pairs of functions on the same axes :
f(x) = sin , g(x) = sin x
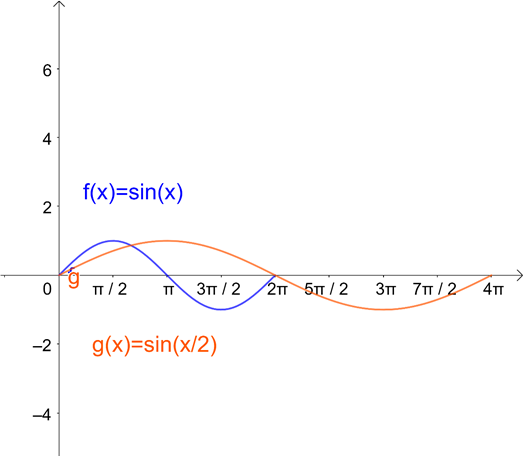
We observe that the functions f(x) = sin x/2 and g (x) = sin x are periodic functions with periods π and 2π.
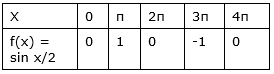
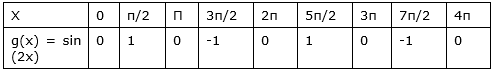
The values of these functions are tabulated below:
Values of f (x) = sin x/2 in [0, π]
Values of g (x) = sin (x) in [0, 2π]
By plotting the above points, we obtain the required curve.
2