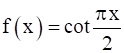
Sketch the graphs of the following functions :
We know that g (x) = cot x is a periodic function with period π.
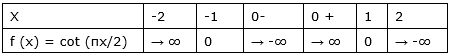
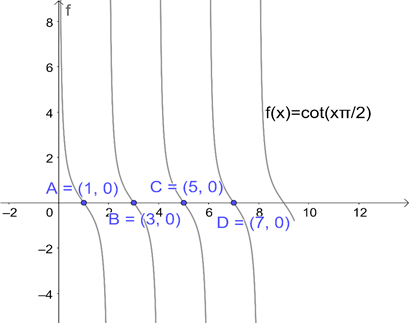
∴ f (x) = cot (πx/2) is a periodic function with period 2. So, we will draw the graph of f (x) = cot (πx/2) in the interval [0, 2]. The values of f (x) = cot (πx/2) at various points in [0, 2] is listed in the following table:
By plotting the above points, we obtain the required curve.
7