The length of 40 leaves of a plant is measured correct to one millimeter, and the obtained data is represented in the following table:
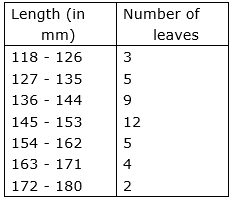
(i) Draw a histogram to represent the given data.
(ii) Is there any other suitable graphical representation for the same data?
(iii) Is it correct to conclude that the maximum number of leaves are 153 mm long? Why?
To Find:
(i) Histogram for the data
(ii) Suitable graphical representation for the data
(iii) Check validity of statement: Is a maximum number of leaves are 153 mm long?
Given: Length of 400 leaves of a plant.
Concept Used:
Histogram: a diagram consisting of rectangles whose area is proportional to the frequency of a variable and whose width is equal to the class interval.
Explanation:
(i) The data is represented in a discontinuous class interval. So, at first we will make it continuous.
The difference is 1.
So, we subtract 0.5 from the lower limit and add 0.5 to the upper limit.
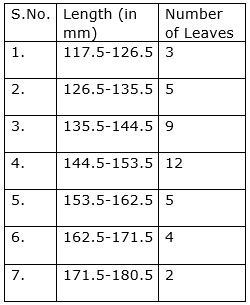
Now, the above information is represented by the histogram below:

(ii) Yes, the above-given data can also be represented by the frequency polygon.
(iii)No, it is incorrect to conclude that the maximum number of leaves are lying between length of 144.5 – 153.5
Explanation: Maximum length of leave lies between 144.5 - 153.5, it is not necessarily 153 mm. It can be any value between the range.