Fig 8.11 shows the distance-time graph of three objects A,B and C. Study the graph and answer the following questions:
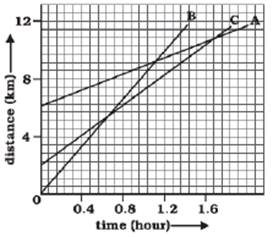
(a) Which of the three is travelling the fastest?
(b) Are all three ever at the same point on the road?
(c) How far has C travelled when B passes A?
(d) How far has B travelled by the time it passes C?
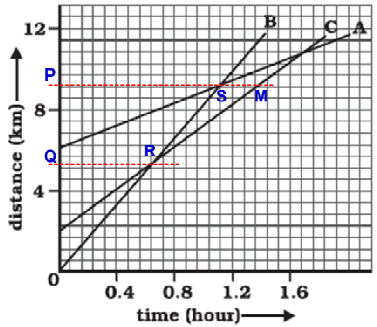
(a) It is clear from graph that B covers more distance in less time. Therefore, B is the fastest.
(b) All of them never come at the same point at the same time.
(c) According to graph; each small division shows about 0.57 km.
A is passing B at point S which is in line with point P (on the distance axis) and shows about 9.14 km
Thus, at this point C travels about
9.14 – (0.57 x 3.75) km = 9.14 km – 2.1375 km = 7.0025 km ≈ 7 km
Thus, when A passes B, C travels about 7 km.
(d) B passes C at point Q at the distance axis which is ≈ 4km + 0.57km x 2.25 = 5.28 km
Therefore, B travelled about 5.28 km when passes to C