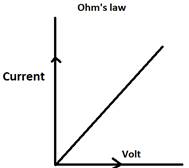
What kind of graph is obtained by plotting values of V and I? Why?
The graph obtained by plotting the values of V and I is a linear graph. We will observe that as the voltage V increases the value of current I also increases linearly.
This happens because we know that according to the Ohm’s Law:
![]()
![]()
9