
Chapter 8
Journey Inside the Atom
Think It Over
- Are atoms the smallest indivisible Grade 8 Curiosity Chapter 7 particles?
- Why do electrons not fall into the nucleus even though they are attracted to protons in it?
- Why did scientists keep modifying atomic models?
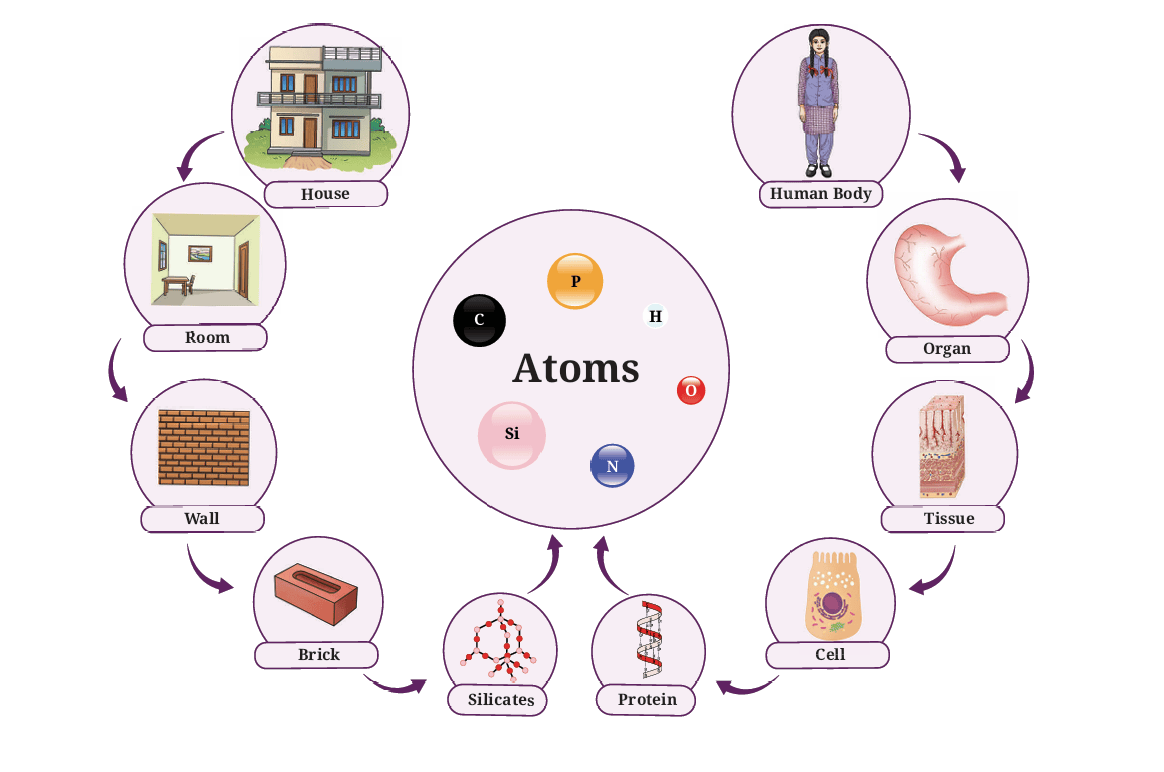
Everything that you see or observe, or feel around is matter. You have learnt that matter consists of tiny particles called atoms. Take a closer look at the picture given above. What do you observe? Do you notice that both living beings, like us, and non-living things, like a house, are ultimately composed of atoms? These atoms are so tiny that they cannot be seen with the naked eye.
You may be wondering — Is an atom truly the smallest unit of matter, or can it be divided even further?
Scientists, too, have been exploring whether atoms are divisible. If so, what are their constituents and how are these arranged? Let us examine how the concept of atoms emerged and how it has been evolved since then.
8.1 Rediscovering the Roots of Atomic Theory
Let us embark on a journey that takes us back more than 2,000 years, to the intellectual landscapes of ancient India and ancient Greece. In these distant yet remarkably parallel civilisations, profound thinkers, such as Acharya Kanada in India, and Leucippus and Democritus in Greece, pondered over the same fundamental question that has continued to inspire human inquiry across centuries — What is everything made up of?
Acharya Kanada suggested that if matter (dravya) is divided repeatedly, you will reach a stage where you would encounter the smallest particles that can no longer be divided. He called these particles parmanus. His ideas are recorded in the Sanskrit text Vaisesika Sutras. A parmanu is infinitely small and cannot be perceived by the senses. Combinations of these forms dyads (groups of two parmanus) and triads (groups of three parmanus), and so on. It is out of these combinations that the whole of the material universe including the bodies of living beings is created. However, this description does not specify the proportions in which parmanus combine to form different substances.
The Greek philosophers Leucippus and Democritus also proposed a similar idea. They called these indivisible particles atomos (in Greek, atomos means indivisible).
You must remember that the concept of ‘atom’ originated as an imaginary idea rather than from experimental observations.
Many centuries later, in 1808, John Dalton proposed his atomic theory. It was based on scientific experiments of that time. He proposed that all matter is composed of indivisible particles called atoms. That is, the atoms are the fundamental building blocks of matter that cannot be broken down into smaller parts. Dalton’s atomic theory was the first scientific description of how matter is made. It became the starting point for the current understanding of atomic structure.
You may be wondering how Dalton’s idea evolved into a model for the structure of the atom.
Following Dalton’s theory, scientists were curious to know the answers of the questions:
- What are atoms made up of ?
- What would atoms look like if we could see them?
- What makes the atoms of one element different from the atoms of another element?
8.2 A Short Historical Journey Through Atomic Models
More than a hundred years ago, scientists tried to imagine what atoms might look like by proposing simple models. As new experiments were performed and new evidence came to light, these models were changed and improved. Although we now know that the early models were not fully correct, they are still important because they show how science moves forward — one step at a time, driven by curiosity, questioning, and experimentation.
Until the late 19th century, atoms were thought to be the smallest, indivisible units of matter. However, scientists discovered that certain elements emit invisible energy and particles called radiation,a phenomenon known as radioactivity. This showed that atoms must be composed of smaller particles, proving that they were not indivisible as previously believed.
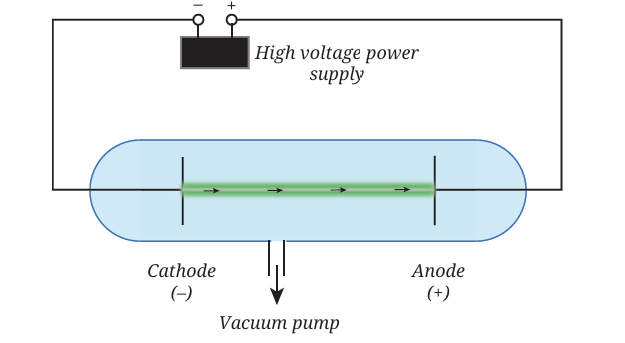
In 1897, J. J. Thomson studied the conduction of electric current through gases at a very low pressure. He used a glass tube with two electrodes and applied a high voltage. He observed rays moving from the cathode (negative electrode) to the anode (positive electrode) (Fig. 8.1). These were called cathode rays. By studying these cathode rays in electric and magnetic fields, he concluded that they are streams of negatively charged particles, with a much smaller mass than atoms. These particles, later called electrons, were emitted from atoms, indicating that atoms are composed of smaller subatomic components.
Note
Meet a Scientist
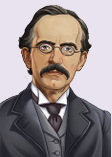 J. J. Thomson’s
most
significant
discovery
was that of
the electron,
the first
subatomic particle to be
identified and a part of
every atom. He received
the Nobel Prize in Physics
in 1906 for his studies of
the electrical conductivity
of gases. This research led
him to discover electrons.
As the head of the famous
Cavendish Laboratory
in Cambridge, he guided
and inspired many
scientists, including Ernest
Rutherford.
J. J. Thomson’s
most
significant
discovery
was that of
the electron,
the first
subatomic particle to be
identified and a part of
every atom. He received
the Nobel Prize in Physics
in 1906 for his studies of
the electrical conductivity
of gases. This research led
him to discover electrons.
As the head of the famous
Cavendish Laboratory
in Cambridge, he guided
and inspired many
scientists, including Ernest
Rutherford.
It was found that the nature of cathode rays was independent of the material of the cathode and the gas filled in the cathode ray tube. It showed that electrons are a fundamental component of all atoms, present in every element. The charge of an electron (–1.602 × 10⁻¹⁹ C) is taken as –1 as a matter of convention and convenience.
8.2.1 Thomson’s model of an atom
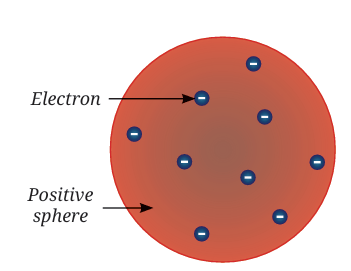
When J. J. Thomson discovered tiny negatively charged particles called electrons, he faced a puzzle — atoms are neutral, so where is the positive charge present? To solve this, Thomson proposed the atom to be a sphere of positive charge with electrons distributed throughout it (Fig. 8.2). This model was compared to a pudding with plums embedded in it, called the plum pudding model. A more familiar picture would be that of a watermelon (Fig. 8.3), where the red pulp represents the positively charged matter, and the seeds represent electrons distributed throughout the atom. This simple picture, though later replaced, was the first genuine attempt to describe how the atom’s positive and negative charges stay balanced.

Pause and Ponder
- Suppose you made up your own ‘atom’, as Thomson described, using clay for the positive charge and small beads for the electrons spread through it. What will happen if:
- the positive charge on the clay is lesser than the total negative charge of the beads?
- by mistake, the clay itself carries a bit of negative charge? Would your model still represent a neutral atom?
- Could an orange or a lemon, which also contain seeds inside soft pulp, be a good comparison? In what ways does it match Thomson’s idea and where does it fall short?
- Why did Thomson conclude that electrons are present in all atoms?
8.2.2 Testing Thomson’s model: The gold foil experiment
In 1911, Geiger and Marsden, working under Ernest Rutherford, tested Thomson’s model of the atom through what became famous as the gold foil experiment. They aimed a narrow beam of alpha particles at an extremely thin sheet of gold foil. Alpha (symbol α) particles are tiny, positively charged particles emitted from certain radioactive elements. Later in this chapter, you will learn that an alpha particle is actually a nucleus of a helium atom containing two protons and two neutrons. According to Thomson’s model, the positive charge in the atom was spread out evenly. So they expected the alpha particles to pass straight through the gold foil or be deflected only slightly. But to their surprise, while most particles passed through undeflected, some were sharply deflected (Fig. 8.4), and a few even bounced back. This deflection from the straight path is called scattering. Hence, the gold foil experiment is also called an α-ray scattering experiment.
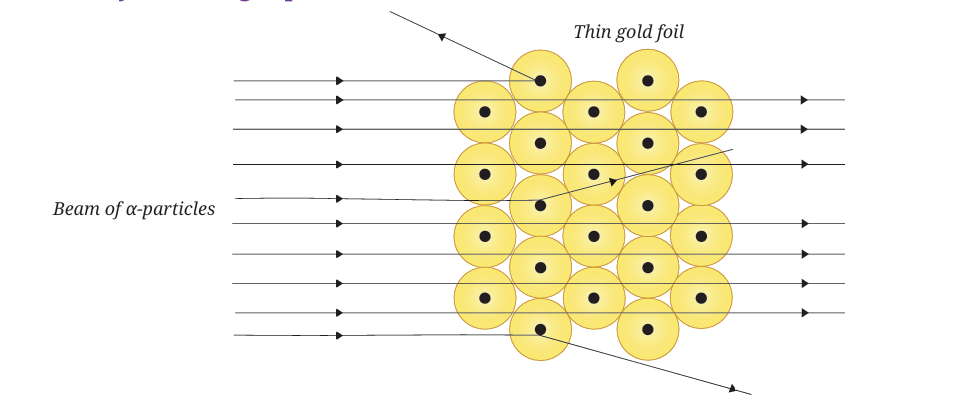
T homson’s model failed to explain the results of the gold foil experiment, particularly the deflection of some α-particles through large angles and that most of the α-particles passed undeflected.
A. Rutherford’s model of an atom
From the gold foil experiment, Rutherford concluded that the positive charge of an atom is not spread throughout but remains concentrated in an extremely small region called the nucleus. He proposed that:
- Most of an atom is empty space, as most α-particles passed through the gold foil without any deflection.
- The nucleus is dense, contains all the positive charge and most of the mass of an atom.
- The electrons revolve around the nucleus, somewhat like planets orbiting the Sun. Hence, this model is called the planetary model of the atom (Fig. 8.5).

Rutherford found that the nucleus is extremely small — about 105 (one lakh) times smaller than the atom. He calculated that the diameter of an atom is ≈ 10−10 m, and the diameter of the nucleus is ≈ 10–15 m. You can imagine that if an atom were of the size of a cricket ground (about 100 m across), the nucleus would be just a tiny black pepper grain (a few mm) at the centre!
Ready to Go Beyond
If the diameter of one atom is about 10–10 m, and the sheet is 0.1 mm (10–4 m) thick, number of atoms ≈ (10–4 m) ÷ (10–10 m) = 106
That is about one million atoms need to be stacked together! When these atoms come together, they form the solid materials we see and touch. What feels like a simple sheet is actually a vast assembly of tiny building blocks, all neatly arranged. It’s amazing how the unseen atomic world shapes everything we see and use every day!
Think as a Scientist
Hint: Compare thin foil vs thick foil. How does the thickness affect the chances of hitting a nucleus?
Pause and Ponder
- What do you think would happen if α-particles were replaced with negatively charged particles in Rutherford’s gold foil experiment?
- Rutherford found that a few α-particles bounced back sharply. How does this single surprising result completely rule out Thomson’s ʻplum pudding modelʼ of the atom?
- If you could ask Rutherford one question about his work, what would it be?
Rutherford’s atomic model was better than Thomson’s atomic model in explaining the results of the gold foil experiment. However, it had a limitation. It could not explain the stability of the atom.
Meet a Scientist
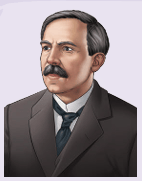 Born
in New
Zealand,
Ernest
Rutherford
moved to
Cambridge
to work with J. J. Thomson
and later became known
as the Father of Nuclear
Physics. He discovered
the atomic nucleus and
explained how some
elements naturally break
down, for which he won
the 1908 Nobel Prize in
Chemistry. In 1911, he
proposed the nuclear
model of the atom. His
portrait now appears
on New Zealand’s $100
banknote.
Born
in New
Zealand,
Ernest
Rutherford
moved to
Cambridge
to work with J. J. Thomson
and later became known
as the Father of Nuclear
Physics. He discovered
the atomic nucleus and
explained how some
elements naturally break
down, for which he won
the 1908 Nobel Prize in
Chemistry. In 1911, he
proposed the nuclear
model of the atom. His
portrait now appears
on New Zealand’s $100
banknote.
B. Limitations of Rutherford’s model
While the idea of a central nucleus was a major step forward, Rutherford’s model could not explain why atoms are stable.
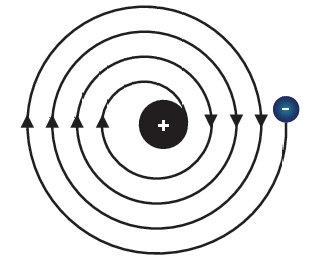
As you have learnt in Chapter 4, Describing Motion Around Us, a particle moving in a circular path is constantly changing direction, which means it is accelerating. If a negatively charged electron keeps accelerating around the nucleus, it should lose energy. Losing energy would make it spiral inward and eventually fall into the positively charged nucleus (Fig. 8.6). If that really happened, atoms would collapse and would not exist! But in reality, atoms are stable that is why matter around us stays intact. This meant that Rutherford’s model was not completely correct, and a new explanation was needed to describe how electrons remain in motion without collapsing into the nucleus.
But before we come to that, you need to know about another subatomic particle, the proton, discovered and named by Rutherford.
C. Discovery of the proton
Rutherford showed that the nucleus carries positive charge which comes from the particles called protons. Protons are much heavier than electrons and possess a charge equal and opposite to that of electrons.
For an atom to be electrically neutral, the number of protons must be equal to the number of electrons. For example, a helium atom has 2 protons and 2 electrons, while a sodium atom has 11 protons and 11 electrons. Since the total positive charge equals the total negative charge, the helium or the sodium atoms are also electrically neutral. Similarly, all the atoms are electrically neutral.
Pause and Ponder
Reason (R): According to Thomson’s model, electrons are embedded in a uniformly distributed positive charge sphere.
Choose the correct option:
- Both A and R are true, and R is the correct explanation of A.
- Both A and R are true, but R is not the correct explanation of A.
- A is true, but R is false.
- A is false, but R is true.
8.2.3 Bohr’s model of the atom
To explain why atoms are stable, Niels Bohr proposed a new model of the atom in 1913. According to Bohr:
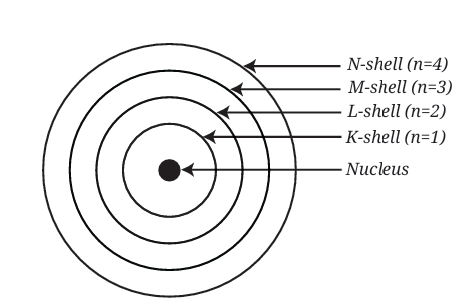
- Electrons do not move randomly around the nucleus but follow fixed circular paths called stationary states, orbits, or shells. In each shell, an electron has a definite amount of energy, so these shells are also called energy levels.
- These shells are represented by the letters K, L, M, N, ... or by the numbers n = 1, 2, 3, 4, ... (Fig. 8.7).
- Electrons can revolve only in these allowed shells, and not in between them. While moving in a fixed shell, an electron does not lose energy.
- The first energy level K (n = 1) is the one closest to the nucleus (Fig. 8.7) and has the least energy.
- The energy of these levels increases as we move away from the nucleus. That is, the energy of an electron in the L-shell (n = 2) is more than that of an electron in the K-shell (n = 1). The farther away a shell is from the nucleus, the higher is its energy.
- An electron can move to another shell by absorbing or releasing a f ixed amount of energy equal to the difference between the energies of the two levels.
- Each shell can hold only a certain number of electrons.
You may be wondering, how does Bohr’s model explain stability? In Bohr’s model, electrons also move in circular paths around the positively charged nucleus, as in Rutherford’s model. But why don’t they lose energy while doing so? Bohr addressed this by introducing the concept of stationary states as a postulate. In a stationary state, the energy of an electron remains constant, even though it is in motion around the nucleus. Bohr’s model could explain many experimental observations and marked a major step in understanding the atomic structure.
Meet a Scientist
 Niels Bohr was
a professor
of physics at
Copenhagen
University,
Denmark. He
was curious
about how atoms
exist because
the old models
could not explain
why electrons
stay around the
nucleus without
collapsing. His
explanation of the
atomic structure
provided more
clarity. Niels Bohr
received the Nobel
Prize in 1922, for
his work on the
structure of the
atom.
Niels Bohr was
a professor
of physics at
Copenhagen
University,
Denmark. He
was curious
about how atoms
exist because
the old models
could not explain
why electrons
stay around the
nucleus without
collapsing. His
explanation of the
atomic structure
provided more
clarity. Niels Bohr
received the Nobel
Prize in 1922, for
his work on the
structure of the
atom.
Threads of Curiosity
Later, even Bohr’s model was found to have limitations, and yet another model, the quantum mechanical model, was proposed. You will learn about it in higher grades.
8.3 What Components Contribute to the Mass of an Atom?
Rutherford’s model showed that most of the mass of an atom is concentrated in its nucleus. Electrons that revolve around the nucleus are so light that their mass can be ignored.
However, something puzzling appeared early in the 20th century. For instance, a hydrogen atom has one proton, whereas a helium atom has two protons, yet the mass of a helium atom is about four times that of a hydrogen atom, not double. This led scientists to wonder whether besides protons, is there something else in the nucleus adding mass without affecting its charge?
What if ...
Ready to Go Beyond
8.3.1 Discovery of the Neutron
In 1932, this problem was solved by James Chadwick (a student of Ernest Rutherford). He discovered a new subatomic particle with a mass nearly equal to that of a proton but no electrical charge. This neutral particle was named as neutron and is usually represented by the symbol ‘n’. The neutrons are found in the nucleus of all atoms except hydrogen. Thus, the mass of an atom comes mainly from its protons and neutrons packed tightly in the nucleus. This also explains why atoms are heavier than the mass of their total number of protons. Table 8.1 shows the symbols and relative charges of subatomic particles.
Table 8.1: Symbols and relative charges of subatomic particles
| S.No. | Subatomic particle | Symbol | Relative charge |
|---|---|---|---|
| 1. | Electron | e- | -1 |
| 2. | Proton | p+ | +1 |
| 3. | Neutron | n0 | 0 |
Meet a Scientist
 James
Chadwick,
working
under
Rutherford
at the
famous
Cavendish
Laboratory at the University
of Cambridge, solved
a key puzzle in 1932,
when he discovered the
neutron. This breakthrough
explained atomic mass
and earned him the Nobel
Prize in Physics in 1935.
The neutron immediately
transformed research,
enabling scientists to probe
nuclear secrets, and sparked
a chain of discoveries
in understanding and
harnessing atomic energy.
James
Chadwick,
working
under
Rutherford
at the
famous
Cavendish
Laboratory at the University
of Cambridge, solved
a key puzzle in 1932,
when he discovered the
neutron. This breakthrough
explained atomic mass
and earned him the Nobel
Prize in Physics in 1935.
The neutron immediately
transformed research,
enabling scientists to probe
nuclear secrets, and sparked
a chain of discoveries
in understanding and
harnessing atomic energy.
Threads of Curiosity
You may wonder that since all the protons with like charges are squished together in a nucleus why do they not push each other away?
Think of it this way — every proton inside the nucleus repels every other proton because they all carry positive charge. Neutrons being neutral help reduce this repulsion by intervening and increasing the distance between protons, and also by strengthening the force, called the nuclear force, that binds all particles together. So, heavier atoms need many more neutrons to hold everything in the nucleus tightly bound.
India's Scientific Contributions

By 1869, scientists knew about 69 elements, most of which were found naturally on the Earth. Today, we know about 118 unique chemical elements. Some of these are artificially made, and the search for even more continues.
Now, let us explore how elements began to be represented for the sake of simplicity.
8.4 Symbols of Elements
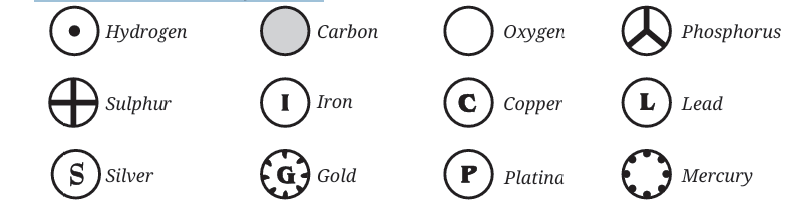
John Dalton realised the need for a standard way to represent elements and compounds to make the study of chemistry easier. In 1803, he introduced the first pictorial symbols to represent the known elements. The Fig. 8.9 shows some of the symbols.
In 1813, Berzelius suggested that the symbols of elements should be derived from their Latin names. Thus, came alphabetic chemical symbols. Nowadays, the International Union of Pure and Applied Chemistry (IUPAC), an international scientific organisation, approves the names and symbols of elements. Some of the norms of writing these symbols are:
- Many symbols are the first letter or the first two letters of the name of the element.
- The first letter of a symbol is always written as a capital letter (uppercase) while the second letter (if there is one) is written as a small letter (lowercase). For example, hydrogen, H; aluminium, Al (not AL); cobalt, Co (not CO), etc.s
- Symbols of some elements are formed from the first letter of the name and a letter other than the second letter in the name. For example, chlorine, Cl; zinc, Zn, etc.
- Symbols of some elements come from their Latin, Greek, or German names rather than English. For example, the symbol for iron is Fe (from Latin ferrum), for mercury is Hg (from Greek hydrargyros), and for tungsten is W (from German wolfram).
- Names and symbols of some commonly used elements are given in Table 8.2.
Table 8.2: Names of some common elements and their symbols
| Name of the element | Symbol | Name of the element | Symbol | Name of the element | Symbol |
|---|---|---|---|---|---|
| Aluminium | Al | Copper (Cuprum) | Cu | Nitrogen | N |
| Argon | Ar | Fluorine | F | Oxygen | O |
| Barium | Ba | Gold (Aurum) | Au | Potassium (Kalium) | K |
| Boron | B | Hydrogen | H | Silicon | Si |
| Bromine | Br | Iodine | I | Silver (Argentum) | Ag |
| Calcium | Ca | Iron (Ferrum) | Fe | Sodium (Natrium) | Na |
| Carbon | C | Lead (Plumbum) | Pb | Sulfur | S |
| Chlorine | Cl | Magnesium | Mg | Uranium | U |
| Cobalt | Co | Neon | Ne | Zinc | Zn |
Scientists use these symbols instead of full names because they are internationally recognised and allow scientists worldwide to communicate clearly, regardless of language barriers.
Pause and Ponder
9. What problems could arise if every scientist used different symbols for the same element?
8.5 Atomic Number
You have learnt that the atoms of an element are all alike but different from the atoms of other elements. They differ in the number of electrons and protons in them. The number of protons in the nucleus of an atom of an element is known as its atomic number. It is designated by the symbol Z, this number determines the identity of an element and its chemical behaviour.
Since the atom as a whole is neutral, the number of protons in it equals the number of electrons orbiting the nucleus. For example, hydrogen has one proton and one electron, so its atomic number is 1. Helium, with atomic number 2, has 2 protons and 2 electrons.
Can you now say that elements with different atomic numbers are distinct from each other, and the atomic number uniquely identifies an element? Observe Fig. 8.10. How many neutrons and protons are present in a lithium atom, and what is its atomic number?
8.6 Mass Number
As stated earlier, helium has two protons, but its mass is about four times that of a proton. The total number of protons and neutrons present in the nucleus of an atom is called its mass number, and is denoted by A. The protons and neutrons present in the nucleus are called nucleons.
Mass number = Number of protons + Number of neutronsSince, the mass of a neutron is roughly equal to that of a proton, the mass of a helium atom can be accounted by two protons and two neutrons. A few examples are given in Table 8.3.
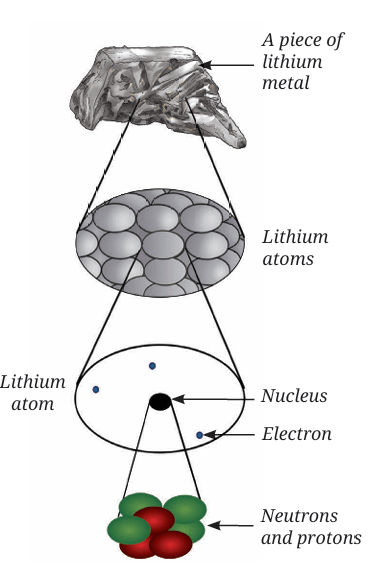
Table 8.3: Mass number of different elements
| Element | Protons (p+) | Neutrons (n0) | Mass number (A) |
|---|---|---|---|
| Hydrogen | 1 | 0 | 1 |
| Helium | 2 | 2 | 4 |
| Lithium | 3 | 4 | 7 |
The electron, in comparison, has almost negligible mass, and hence, can be ignored in calculations.
In the standard notation for an atom, the symbol, the atomic number (Z) and mass number (A) of the element are written as —
Pause and Ponder
- An atom with an atomic number of 26 has 56 nucleons. Find out its number of electrons, protons and neutrons.
- The nucleus of an atom contains 20 protons. If its mass number is 41, find the number of neutrons in it.s
- An atom has 18 neutrons and an atomic number of 17. What is its mass number?
- An atom 23A has 11 electrons. Find the number of neutrons in it.
Mass Number
| Symbol of element |
For example, the symbol for carbon is C, its atomic number is 6, and its mass number is 12. In notation, it would be written as —
126C
So far, you know that protons and neutrons are located in the nucleus of an atom, while electrons move around the nucleus. Now, let us explore how electrons are arranged around the nucleus.
8.7 How Are Electrons Distributed in Different Energy Levels?
Bohr and Bury suggested the following rules:
- The maximum number of electrons present in a shell is given by the formula 2n2, where ‘n’ is the number of the shell (Fig. 8.7). Hence, K-shell (n = 1) 2×1² = 2, can accommodate 2 electrons, L-shell (n = 2) 2×2² = 8 electrons, and M-shell (n = 3) 2×3² = 18 electrons.
- The maximum number of electrons that can be accommodated in the outermost shell is 8 (the first shell can accommodate a maximum of two electrons).
- Electrons are filled in these shells in a stepwise manner, starting from the one closest to the nucleus and moving outward, i.e., in the order K, L, M, N, … The L-shell will be filled only after the K-shell is complete, and so on.
To understand the placement of electrons in atoms, let us begin with hydrogen (atomic number 1). The only electron in it has to be in the K-shell. The electron distribution for hydrogen (H) is depicted in Fig. 8.11. Helium contains two protons in its nucleus and two electrons. In which way will the two electrons be arranged in its atomic shell?
8.7.1 Building up atoms
Let us create two-dimensional (2-D) atomic structures for various elements by adding one electron to the appropriate energy level each time atomic number is increased by 1. The distribution of electrons among various shells is known as the electronic configuration of the atom (Fig. 8.11). Table 8.4 lists the symbols, atomic numbers, number of protons, number of neutrons, number of electrons, and the electron distribution in the shells of the first eighteen elements.
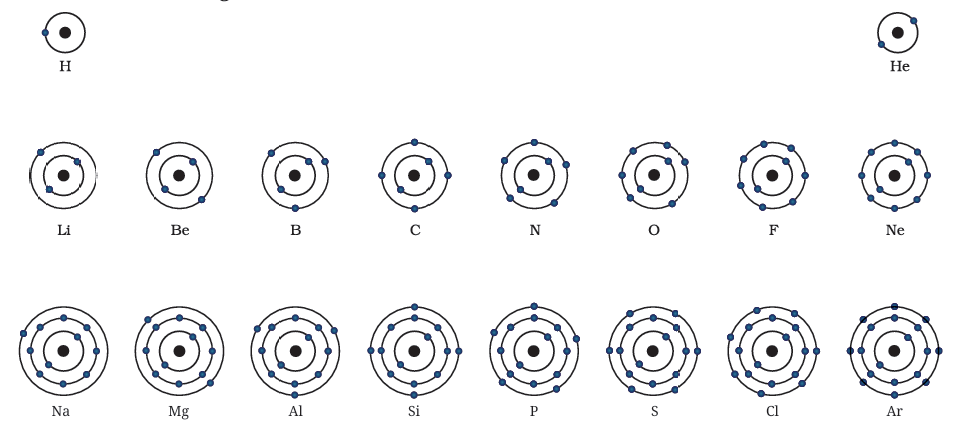
Table 8.4: Symbols, atomic numbers, number of protons, number of neutrons, number of electrons, and the electronic distribution of atoms of the first eighteen elements
| Name of the element | Symbol | Atomic number | Number of protons | Number of neutrons | Number of electrons | Distribution | |||
|---|---|---|---|---|---|---|---|---|---|
| K | L | M | N | ||||||
| Hydrogen | H | 1 | 1 | - | 1 | 1 | - | - | - |
| Helium | He | 2 | 2 | 2 | 2 | 2 | - | - | - |
| Lithium | Li | 3 | 3 | 4 | 3 | 2 | 1 | - | - |
| Beryllium | Be | 4 | 4 | 5 | 4 | 2 | 2 | - | - |
| Boron | B | 5 | 5 | 6 | 5 | 2 | 3 | - | - |
| Carbon | C | 6 | 6 | 6 | 6 | 2 | 4 | - | - |
| Nitrogen | N | 7 | 7 | 7 | 7 | 2 | 5 | - | - |
| Oxygen | O | 8 | 8 | 8 | 8 | 2 | 6 | - | - |
| Fluorine | F | 9 | 9 | 10 | 9 | 2 | 7 | - | - |
| Neon | Ne | 10 | 10 | 10 | 10 | 2 | 8 | - | - |
| Sodium | Na | 11 | 11 | 12 | 11 | 2 | 8 | 1 | - |
| Magnesium | Mg | 12 | 12 | 12 | 12 | 2 | 8 | 2 | - |
| Aluminium | Al | 13 | 13 | 14 | 13 | 2 | 8 | 3 | - |
| Silicon | Si | 14 | 14 | 14 | 14 | 2 | 8 | 4 | - |
| Phosphorus | P | 15 | 15 | 16 | 15 | 2 | 8 | 5 | - |
| Sulfur | S | 16 | 16 | 16 | 16 | 2 | 8 | 6 | - |
| Chlorine | Cl | 17 | 17 | 18 | 17 | 2 | 8 | 7 | - |
| Argon | Ar | 18 | 18 | 22 | 18 | 2 | 8 | 8 | - |
Pause and Ponder
- Identify the number of electrons in the outermost shell of the following elements:
-
126C
199F
2814Si
- Write the electronic configuration of the elements having atomic numbers 12, 16 and 18.
- Solve this riddle: I am an atom with a mass number of 23 and 11 protons. I am a soft metal and react vigorously with water. Who am I and how many neutrons do I have? You can also create one such riddle.
8.8 Combining Capacity of an Atom: Valency
You have learnt that atoms of the same or different elements can combine to form molecules. The number of atoms of hydrogen or chlorine with which one atom of an element can combine to form a compound is called its combining capacity. It is expressed in terms of hydrogen and chlorine because both possess a combining capacity of one. For example, in H2 O (water), oxygen combines with two hydrogen atoms, so the combining capacity of oxygen is two. In NH3 (ammonia) and MgCl2 (magnesium chloride), what will be the combining capacities of nitrogen and magnesium respectively? These examples show how the combining capacity of elements is determined by the number of hydrogen or chlorine atoms they combine with.
Let us learn how the combining capacity of an atom is decided by its electronic configuration.
The outermost shell containing electrons of an atom is known as its valence shell. The electrons present in it are known as valence electrons.
If the outermost shell of an atom has 8 electrons, it is called an octet. It has been observed that elements with complete octet of electrons (8 electrons), or 2 electrons in the case of helium in their valence shell are largely unreactive and more stable. On the other hand, atoms with incomplete valence shells are usually more reactive. Such elements lose, gain, or share electrons to complete their octet.
The number of electrons gained, lost, or shared to complete the octet is called the valency of the element. Generally, if the element has fewer than four electrons in its valence shell, it tends to lose electrons to complete its octet and become stable. On the other hand, if the number of valence electrons is more than four, it tends to gain electrons to complete its octet. For example, the electronic configuration of sodium is 2, 8, 1. It can get an octet by losing one electron. Therefore, its valency or combining capacity is 1. On the other hand, oxygen has an electronic configuration of 2, 6. It has six valence electrons. Therefore, it can gain two electrons to attain an octet, its valency is 2. The electronic configuration of carbon is 2, 4. Carbon has four valence electrons and cannot easily gain or lose them. Therefore, it can share four electrons with other atoms to complete its octet. Thus, the valency of carbon is 4. Some compounds appear to violate the usual valency rule, about which you will learn in higher grades.
Can you predict what happens to the atoms that already have eight electrons in their outermost shell (except the elements with one shell only, where only two electrons are possible)? Will they still try to lose or gain electrons?
Examine Table 8.4. Add one more column to it, and write down the common valency of each element.
You have learnt that all the atoms of an element have the same number of electrons and protons, which is equal to its atomic number. Can you say the same regarding the number of neutrons too? Scientists have observed that atoms of the same element can have different numbers of neutrons. What effect does this difference have on the properties of the atom? Let us try to find out!
8.9 A Deeper Look into Atomic Structure
8.9.1 Isotopes
Dalton proposed that all atoms of an element are identical and have the same mass. But scientists later discovered that there were atoms of the same element that could have the same number of protons (atomic number, Z) yet could have different numbers of neutrons, and thus, different mass numbers (A = p+ + n0). These ʻtwin atomsʼ with the same atomic number but different mass numbers are called isotopes
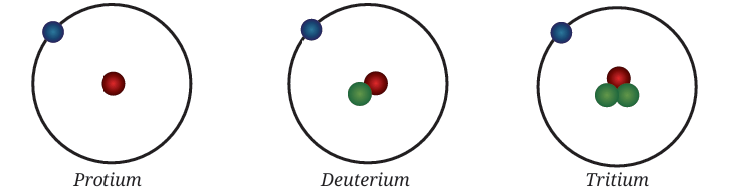
Let us take hydrogen as an example. Naturally occurring hydrogen is a mixture of three different isotopes: 11H(protium, ~99.98%),21H (deuterium, ~0.015%), and 31H(tritium, in traces) (Fig. 8.12). All of these contain one proton each, whereas deuterium contains one neutron, and tritium contains two neutrons. Can you guess how many electrons each of these isotopes have?
The chemical properties of isotopes are similar. Do you know why? It is so because they have the same number of electrons and the same electronic configuration. As you have learnt, chemical properties depend mainly on the number of valence electrons. All the isotopes will have the same chemical properties although they differ in their physical properties, for example, boiling and melting points.
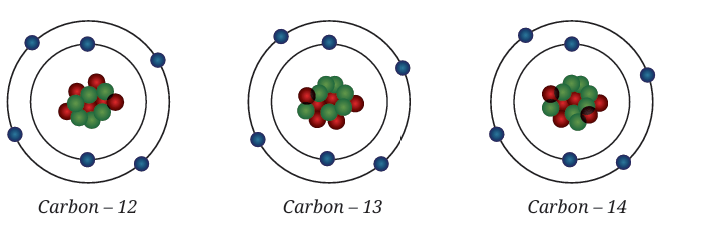
Similarly, carbon has three isotopes: 126C,136C and 146C(Fig. 8.13). Each of these has six protons and six electrons. 126C is the most abundant isotope in nature. You may note that these three isotopes differ in terms of the number of neutrons in them.
Ready to Go Beyond
Let us learn about the essential uses of some isotopes in our daily lives.
Bridging Science and Society
Some isotopes have special properties that are useful in various fields. Some of the applications of isotopes are:
- 23592U, an isotope of uranium, is used as a fuel in a nuclear reactor to generate electricity in a nuclear power plant (Fig. 8.14).
- 6027Co a radioactive isotope of cobalt, is used in radiation treatment for cancer.
- 13153I an isotope of iodine, is used to treat goitre and thyroid cancer.
- 146C an isotope of carbon, is used in archaeology and geology to determine the age of ancient fossils and artefacts.

A. Average atomic mass
Chlorine occurs in nature in two isotopic forms. One isotope has a mass of 35 u, and the other has a mass of 37 u. They occur in the ratio 3:1. This raises an interesting question — should we consider the mass of a chlorine atom to be 35 u or 37 u?
If the atomic mass of a natural element is taken as the average mass of all its naturally occurring isotopes, it would be the simple arithmetic mean of the masses of its isotopes, calculated without accounting for the relative abundances of each isotope. For chlorine, with isotopes ³⁵ Cl and ³⁷ Cl, the simple average would be —s
Average atomic mass =(35+37/2)
However, this does not accurately reflect nature, since isotopes do not occur in equal ratios. The more common isotope is ³⁵ Cl, which constitutes about 75% while the other isotope, ³⁷ Cl makes up about 25%. The accurate average atomic mass can be calculated by considering their natural abundances. This is called a weighted average atomic mass, which can be calculated by multiplying the mass of each isotope by its percent relative abundance and then adding the two values, as explained below.
Mathematically,
Meet a Scientist
 Homi
Jehangir
Bhabha was
an Indian
physicist.
He is known
as the
father of the Indian nuclear
programme. He made a
pioneering contribution
to the development of
atomic energy in India. He
established key institutions
like the Tata Institute of
Fundamental Research (TIFR)
and the Bhabha Atomic
Research Centre (BARC),
for peaceful uses of atomic
energy to generate electricity,
support agriculture, and
advanced medical treatments.
Homi
Jehangir
Bhabha was
an Indian
physicist.
He is known
as the
father of the Indian nuclear
programme. He made a
pioneering contribution
to the development of
atomic energy in India. He
established key institutions
like the Tata Institute of
Fundamental Research (TIFR)
and the Bhabha Atomic
Research Centre (BARC),
for peaceful uses of atomic
energy to generate electricity,
support agriculture, and
advanced medical treatments.
This does not mean that any one atom of chlorine has a fractional mass of 35.5 u. It means that if you take, say 1 million chlorine atoms, they will contain 7.5 lakh 3517Cl and 2.5 lakh 3717Cl atoms with a weighted average atomic mass of 35.5 u.
This comparison shows that the simple average ignores abundance, whereas the weighted average accurately reflects the mass of the element as it occurs in nature.
Pause and Ponder
18. If a bromine atom is available in the form of, say two isotopes, 7935C(49.7%) and 8135Br(50.3%) (50.3%), calculate the average atomic mass of the bromine atom.
You have learnt that the two atoms that have the same atomic number but different mass numbers are called isotopes. What if they have the same mass number but different atomic numbers? What are such atoms called? Let us find out!
Ready to Go Beyond
8.9.2 Isobars
Let us consider three elements — calcium (atomic number 20), potassium (atomic number 19), and argon (atomic number 18). These elements have different numbers of protons, yet each has a mass number of 40. This shows that the total number of nucleons in their atoms is the same, even though they are different elements. When atoms of different elements have the same mass number, but different atomic numbers, they are called isobars.
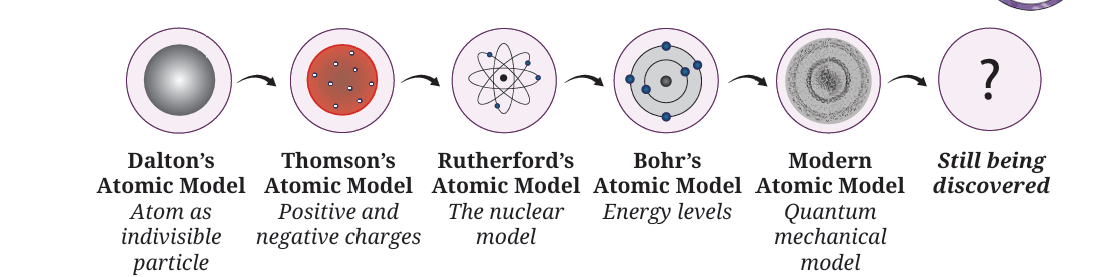
As we end our journey into the structure of the atom, it is important to know that the story does not end here. The exploration of the structure of the atom is still being discovered (Fig. 8.16). Later, scientists discovered that even Bohr’s model was not entirely correct. Electrons do not follow well-defined paths like the fixed Bohr orbits. Today, we understand that they exist as ʻelectron cloudsʼ around the nucleus. We can predict regions where they are most likely to be, not exactly where they are. You will learn all these details in higher grades. The journey of exploring the mysteries of the atom is far from over, and exciting discoveries still lie ahead!
At a Glance
- Atoms are the building blocks of matter.
- J. J. Thomson proposed that in an atom, electrons are embedded in a positively charged sphere.
- Rutherford’s model described the atom as mostly empty space, with a dense, positively charged nucleus at its centre and electrons orbiting it.
- Niels Bohr’s model proposed that electrons move in fixed energy levels (shells) around the nucleus.
- The shells of an atom are named as K, L, M, N, and so on.
- James Chadwick discovered the presence of neutrons in the atom.
- The three subatomic particles of an atom are electrons, protons, and neutrons.
- If the outermost shell of an atom has an octet of electrons (or two electrons in case of helium), the atom is stable and largely unreactive.
- Valency is the combining capacity of an atom. It is equal to the number of electrons which can be gained, lost or shared by an atom to achieve a stable configuration.
- The atomic number of an element is equal to the number of protons in its nucleus.
- The mass number of an atom is equal to the total number of nucleons (protons and neutrons) in its nucleus.
- Isotopes are atoms of same element that have the same atomic number but different mass numbers.
- The average atomic mass of an element is calculated based on the relative abundance of its isotopes in nature.
- Isobars are atoms of different elements with the same mass number but different atomic numbers.
Revise, Reflect, Refine
- Choose the correct options and explain the reason for the correct and incorrect options in the context of Ernest Rutherford’s gold foil experiment:
- The experiment clearly showed the existence of neutrons in the nucleus.
- The results disproved the plum pudding model and led to the idea of a nucleus at the centre of the atom.
- The large deflection of a few alpha particles indicated that most of the mass of the atom and positive charge are packed into a tiny centre.
- The way alpha particles were deflected showed that electrons move around the nucleus.
- Which of the following statements are correct or incorrect according to the Bohr’s atomic model? Give a reason for each statement.
- Electrons lose energy while moving in fixed orbits and slowly fall into the nucleus.
- Electrons can exist anywhere around the nucleus with no fixed energy.
- Electrons revolve around the nucleus in orbits of fixed energy without losing energy.
- Electrons can be found between energy levels as they move around the nucleus.
- The composition of the nuclei of three atomic species X, Y, and Z are given as follows.
- Y and Z
- Z and X
- What conclusion did Rutherford draw about the position and characteristics of the atom’s positively charged part based on the few alpha particles that bounced back or were deflected at large angles in the gold foil experiment?
- Explain and arrange the following statements in the correct chronological order to show how atomic models have evolved over time.
- Bohr’s model proposed that electrons move in fixed orbits around the nucleus, each with a definite energy.
- Thomson’s model depicted the atom as a ʻplum puddingʼ with electrons embedded in a sphere of positive charge.
- Rutherford’s model proposed that atoms have a dense central nucleus.
- Dalton’s model described atoms as indivisible particles.
- Electrons move around the nucleus in orbits. Why do they not fly away from the atom? Explain what keeps them attracted to the nucleus.
- Assertion (A): The discovery of subatomic particles helped in understanding the atomic structure.
- Both A and R are true, and R is the correct explanation of A.
- Both A and R are true, but R is not the correct explanation of A
- A is true, but R is false.
- A is false, but R is true.
- Magnesium is essential for many biological processes, including muscle contraction. For an atom of magnesium with a mass number of 24 and atomic number 12, determine the number of
- protons,
- neutrons,
- electrons, and also illustrate the arrangement of electrons in a magnesium atom.
- Find the following information for the elements shown in Fig. 8.17:
- Name of the element
- Symbol
- Total number of electrons
- Number of valence electrons
- Valency of the element
- Number of protons
- Atomic number
- Both Rutherford’s and Bohr’s models have electrons orbiting the nucleus. Why did Rutherford’s model fail to explain atomic stability, while Bohr’s model succeeded?
- An atom 70 X has 31 electrons. How many neutrons are there in its nucleus?
- An atom has 79 protons and a mass number of 197. Calculate (i) the number of neutrons, and (ii) the number of electrons.
- Complete the Table 8.5:
- Aman was discussing the structure of atom with his classmates. During the discussion, he learnt that an element X has a mass number of 35 and contains 18 neutrons. Based on this information, answer the following questions:
- How many electrons and protons does element X have?
- What is its atomic number?
- Identify the element X.
- Write its electronic configuration
- How many valence electrons does it have?
- What will be the mass number if two neutrons are added to its nucleus?
- What will be the relation of X with the new atom?
- In an atom, there are 12 protons and 12 neutrons in the nucleus. Now, imagine that all the electrons are replaced with some hypothetical particles that have the same charge as electrons but are 500 times heavier. What effect will this replacement have on the atom’s:
- Atomic number
- Atomic mass
- Mass number
- Overall charge
| x | y | z | |
|---|---|---|---|
| Number of protons | 18 | 17 | 17 |
| Number of neutrons | 19 | 18 | 20 |
Explain the relation between the following:
Reason (R): The number of electrons is equal to the number of protons in an atom.
Choose the correct option:
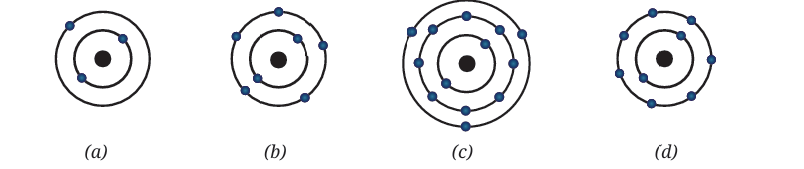
Table 8.5
| Atomic number | Mass number | Number of neutrons | Number of protons | Number of electrons | Name of the elements |
|---|---|---|---|---|---|
| 5 | - | 6 | - | - | - |
| - | 14 | - | - | 7 | Nitrogen |
| - | 24 | - | 12 | - | - |
| 15 | - | 16 | - | - | - |
| - | 1 | 0 | - | - | - |
The Journey Beyond
- Create an ‘Atomic Prediction Board’ game based on atomic number, mass number, number of electrons, protons, neutrons and valency. Students may predict elements using atomic clues.
- Prepare a report on how the properties of atoms impact us in everyday life across fields, such as healthcare, energy, agriculture and technology.
- Create a role-play stage play or story about the ‘Journey Inside the Atom’, and the scientists who discovered and contributed to the identification of atomic structure.
- Use selected software or digital tools and try to create animations or simulations of various atomic models, and share them in the class.
- Watch a film or documentary about the structure of the atom and write a report answering the following questions:
- Which film or documentary did you watch, and what was its main idea or topic?
- What did the film or documentary teach you about the structure of the atom and the atomic model(s)?
- Which scientists were mentioned in the film or documentary, and what were their contributions?
- What part of the film or documentary did you find most interesting, and what question do you still have?
- Draw a bar graph showing the number of electrons in each energy level for any three elements.
- To learn more about atoms, you can explore the links given below:
- https://phet.colorado.edu/en/simulations/rutherford-scattering
- https://phet.colorado.edu/en/simulations/isotopes-and-atomic-mass