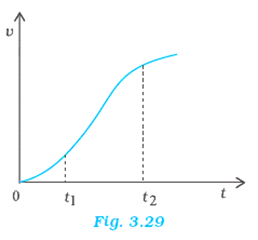
The velocity-time graph of a particle in one-dimensional motion is shown in Fig. 3.29:

Which of the following formulae are correct for describing the motion of the particle over the time-interval t 1 to t 2:
(a) x(t2 ) = x(t1) + v (t1) (t2 – t1) +(1/2) a (t2 – t1)2
(b) v(t2 ) = v(t1) + a (t2 – t1)
(c) vaverage = (x(t2) – x(t1))/(t2 – t1)
(d) aaverage = (v(t2) – v(t1))/(t2 – t1)
(e) x(t2 ) = x(t1) + vaverage (t2 – t1) + (1/2) aaverage (t2 – t1)2
(f) x(t2 ) – x(t1) = area under the v-t curve bounded by the t-axis and the dotted line shown.